

Dr. David Bell, University of Stirling
This post by the University of Stirling’s Dr. David Bell looks at the future costs of State Pensions in Scotland. Dr. Bell argues that given today’s revelations about the Scottish Government’s leaked paper, this is perhaps a useful time to look at some of the facts. This was originally posted at Dr. Bell’s The Scottish Economy and Constitutional Change blog.
The figure below shows projected numbers of pensioners in the constituent countries of the UK looking forward to 2060 indexed on 2010=100 (Source: ONS). Growth in pensioner numbers is slower in Scotland than in England, partly reflecting an assumption that Scots will continue to have lower life expectancy. Nevertheless, the number of Scots pensioners will increase by 80 per cent between 2010 and 2060, with most of the increase concentrated in the 2010-2035 period.
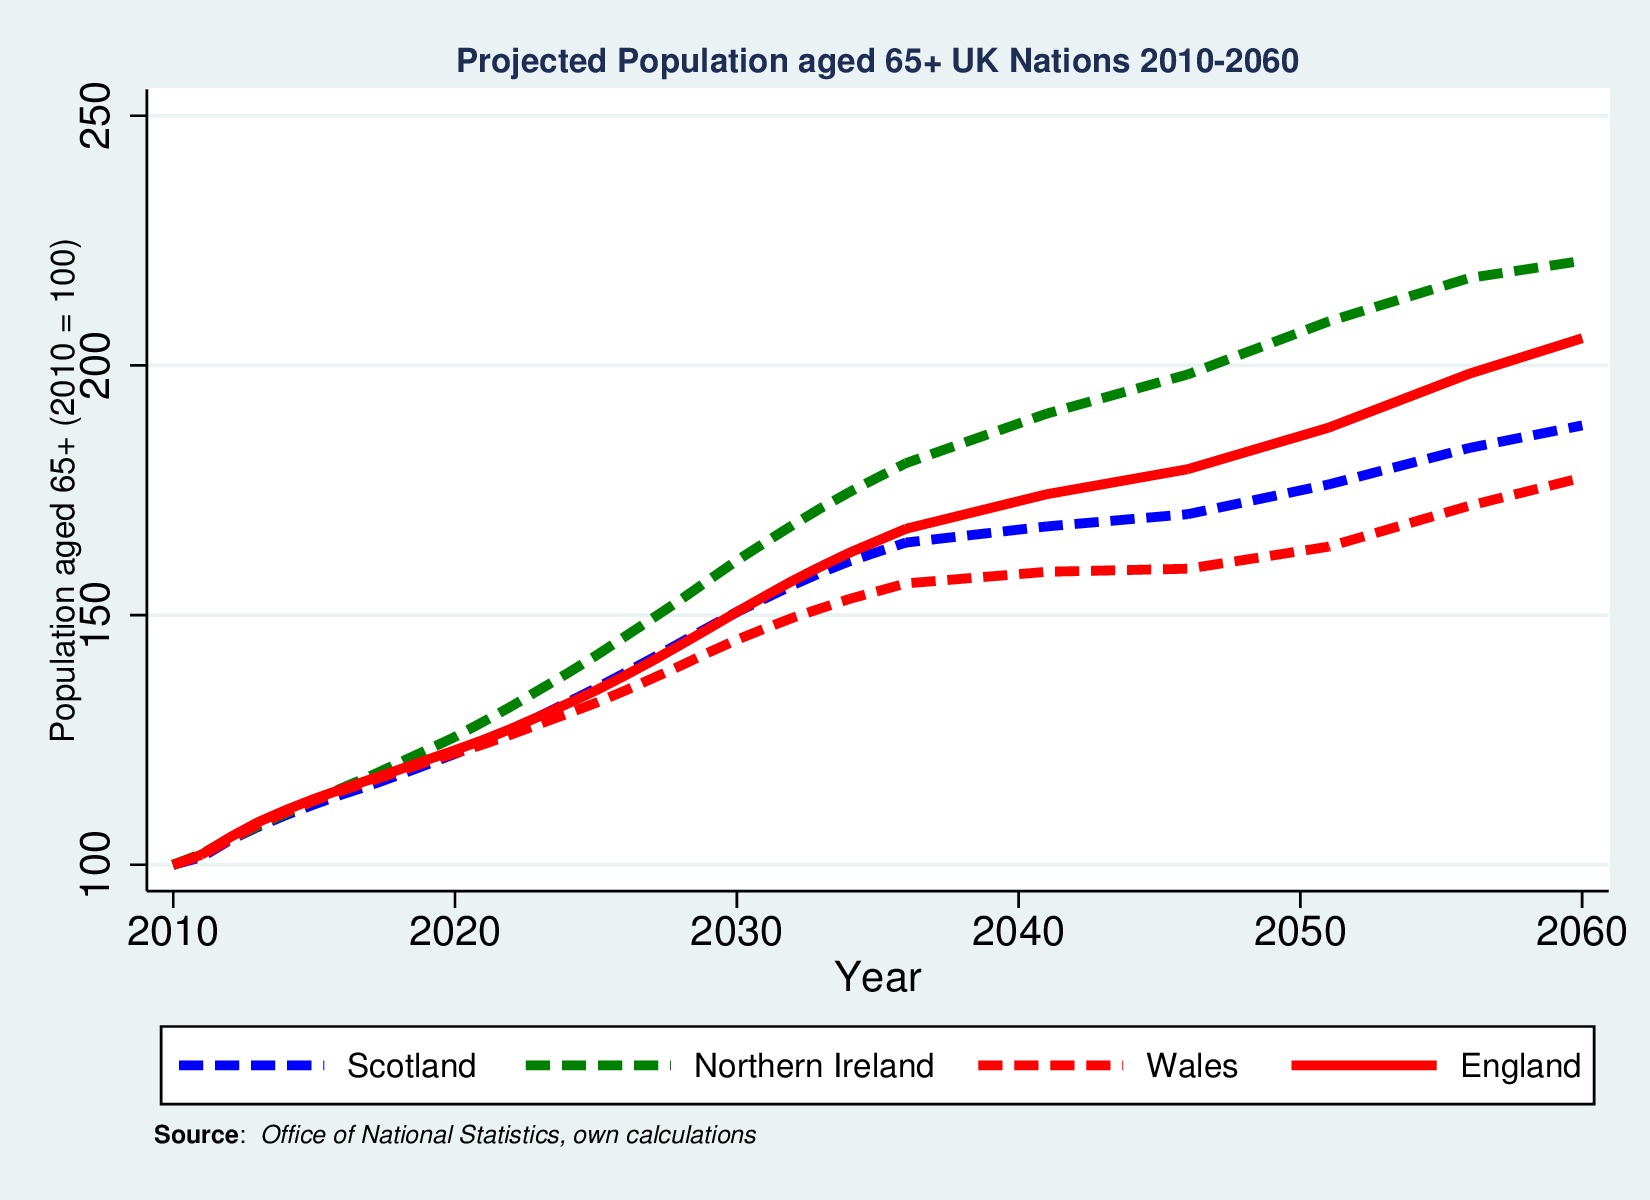
Figure: Indexed Number of Pensioners: Scotland, England, Wales and Northern Ireland 2010-2060
If Scotland acquires new fiscal responsibilities, including control over welfare benefits, there will be a need to raise revenues to meet the increased costs of state pensions. These will have to be derived from the economic activity of the working age population. Retirement ages are set to increase gradually during the next two decades. Nevertheless, meeting the costs of welfare entitlements for older people will require a return to consistent patterns of economic growth if substantial increases in the tax burden are to be avoided.
To illustrate this, the next figure shows a projection of the costs of older people’s benefits in Scotland measured as a share of GDP over the period 2010 to 2060. This is based on the OBR forecast of the future costs of older people’s benefits [1] in the UK as a whole. The projection for Scotland is based on the assumption that costs will largely be determined by Scotland’s share of UK pensioners. If economic performance in Scotland follows that assumed by the OBR for the UK as a whole, and, in particular, worker productivity grows at 2.2 per cent per annum for the period to 2060, then the share of older people’s benefits in GDP would be broadly as shown in Figure 8.
The projection shows pensioner benefits falling as a share of GDP until 2020 and then rising. The reason for the dip during this decade is mainly due to the increase in retirement ages, particularly for women. Thereafter costs trend upward with increasing numbers of pensioners, though they dip after 2040 due to a further projected increase in the retirement age. Another key assumption that affects disability benefits (and also health spending though this is not included in these projections) is that of healthy life expectancy (expected years of disability free life). The OBR assumption is that healthy life expectancy will grow in line with life expectancy at age 65. This assumption is therefore implicit in the projections for Scotland, although, given the earlier discussion of its higher incidence of disability, significant improvement in healthy life expectancy poses a particular challenge for Scotland.
While state pensions dominate benefit payments for older people, other benefits such as AA, DLA and WFP also contribute to the total cost. Their relative contribution is expected to decline over time due to their value being uprated in line with CPI, rather than with the “triple-guarantee [2]” which will apply to state pensions.
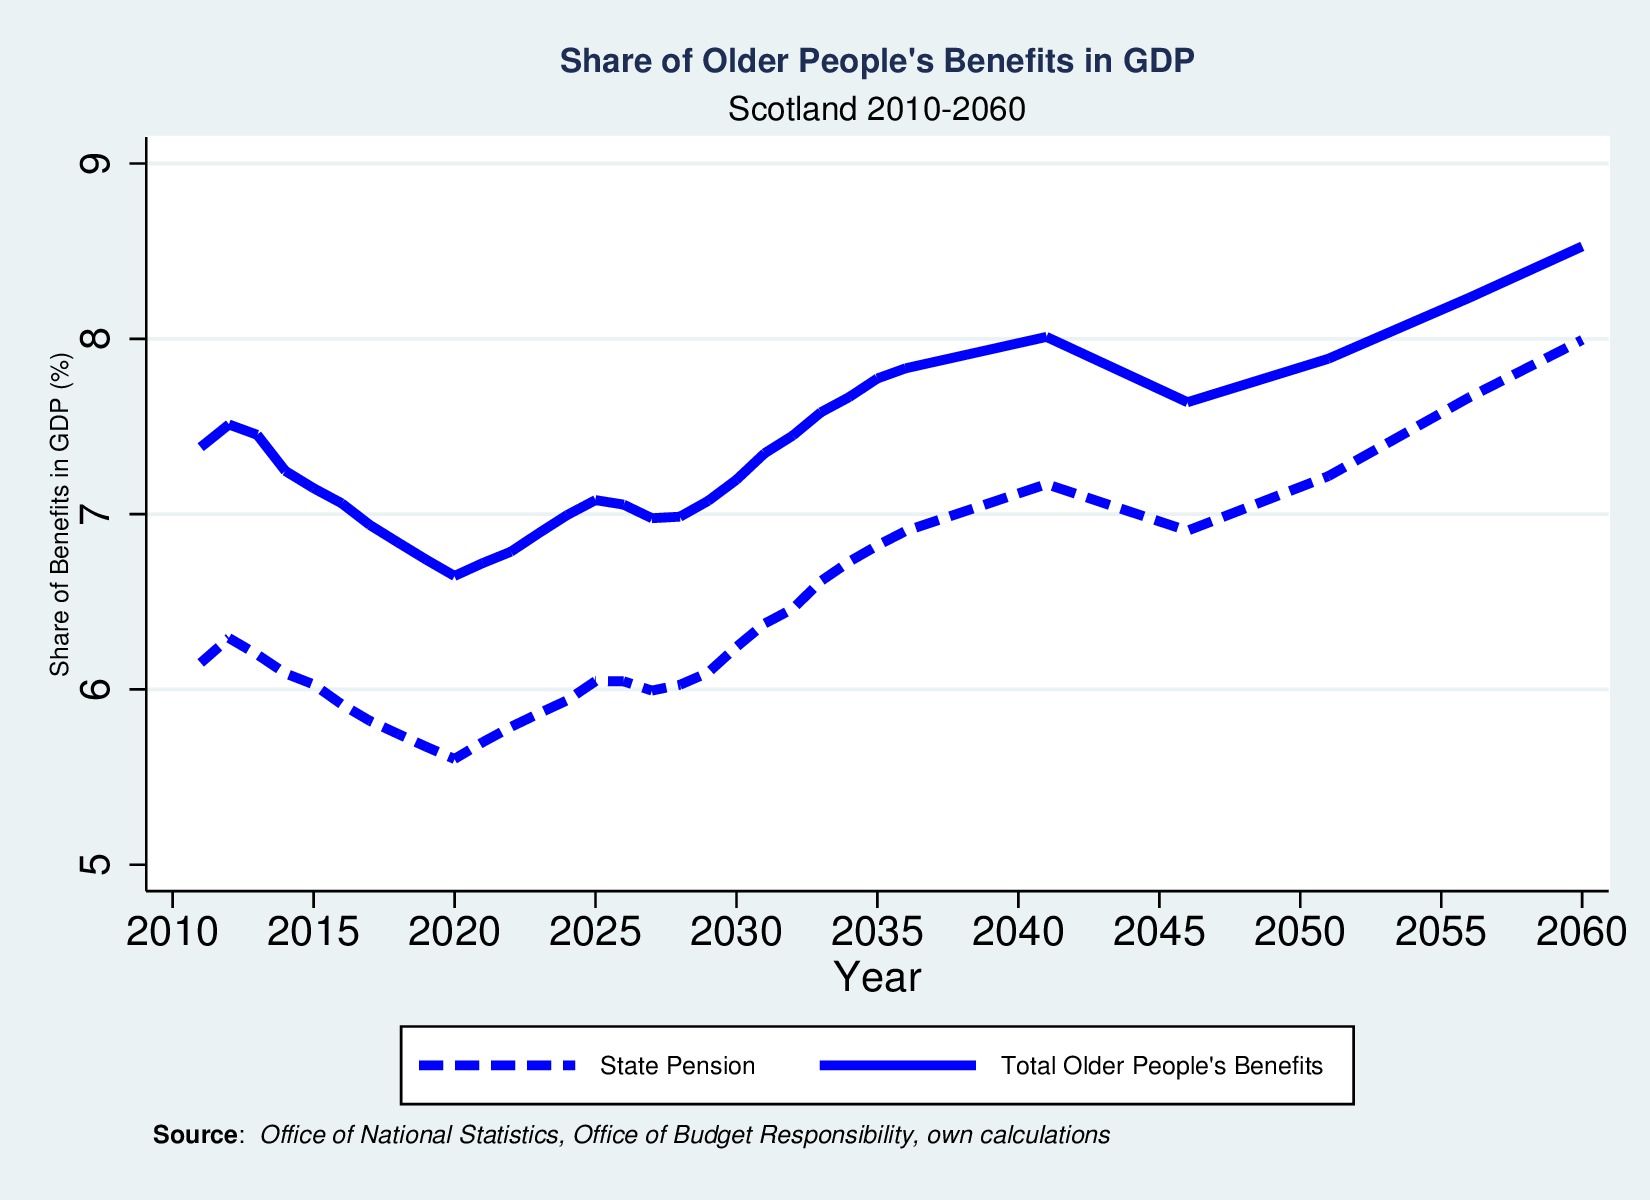
Figure: Projected Costs of Older People’s Benefits as a Share of GDP Scotland: 2010-2060

Figure: Share of Old Age Pensions in GDP if Annual Productivity Growth Reduced by 0.5 per cent
Another critical assumption on the OBR projection is that of consistent productivity growth of 2.2 per cent per annum. A fall in this growth rate would place increased pressure on the public finances. For example, a reduction of 0.5 per cent per annum substantially increases the share of GDP devoted to older people’s benefits (see Figure 9). The lower (dashed) line replicates the central OBR assumption of 2.2 per cent productivity growth, while the upper (continuous) line assumes 1.7 per cent growth. This increases the share of GDP going to older people’s benefits by almost 1 per cent by 2035.
[1] These benefits and the assumptions underlying their evolution are: State Pension Age equalised at 65 by November 2018, with the Pension Credit and Winter Fuel Payment qualifying ages rising in line. State Pension Age reaches 66 by October 2020, and rises further to 67 between 2026 and 2028, and 68 between 2044 and 2046; qualifying ages for Pension Credit, winter fuel payments, Disability Living Allowance and Attendance Allowance rise in line. Basic State Pension uprated using the ‘triple guarantee’ mechanism which is assumed to cause it to grow by earnings growth plus 0.26 percentage points a year. State Second Pensions in payment uprated in line with CPI.
[2] The “triple guarantee” means that state pensions will rise by the greatest of: (1) the rise in average UK earnings, (2) the rise in inflation (as measured by the Consumer Price Index) and (3) 2.5 per cent